Portfolio
Cross-domain diagnostic dashboard suite built with simulated data to demonstrate business impact
Sales Dashboard Preview
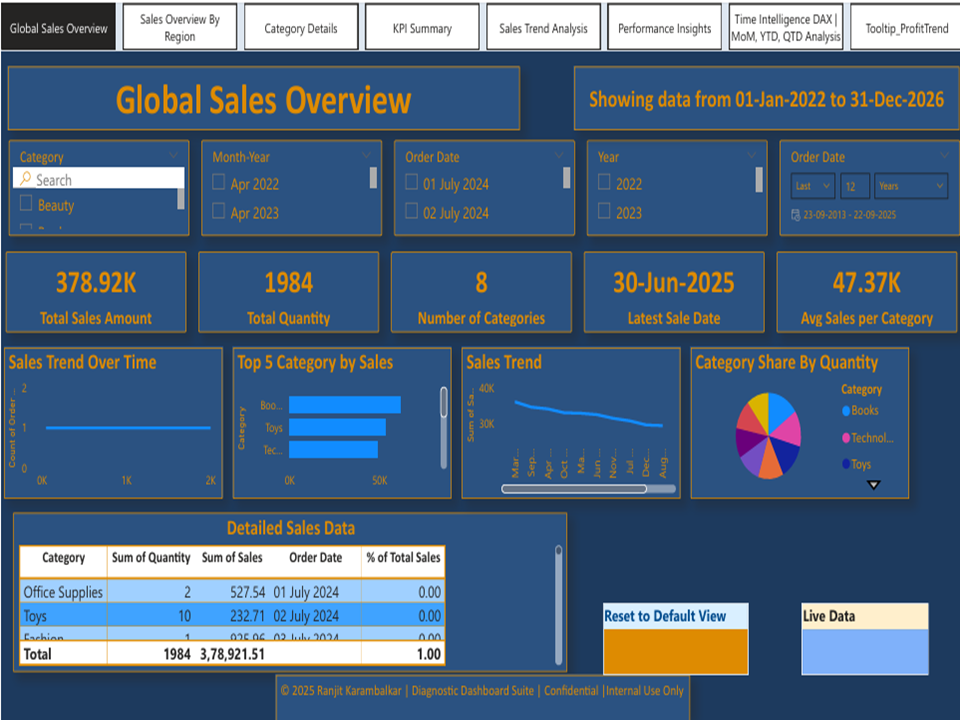
🔽 Sales Performance Dashboard
Sales Analytics📋 Scenario
Simulated mid-size sales team facing inconsistent reporting, Excel overload, and unclear pipeline metrics.
🎯 What I Built
A performance dashboard showing total sales, order volume, win rates, and MoM growth. Filters by region, product, and customer type.
💡 What It Demonstrates
How unified reporting and fast-loading visuals can shorten meetings, align teams, and surface early sales risks.
Finance Dashboard Preview
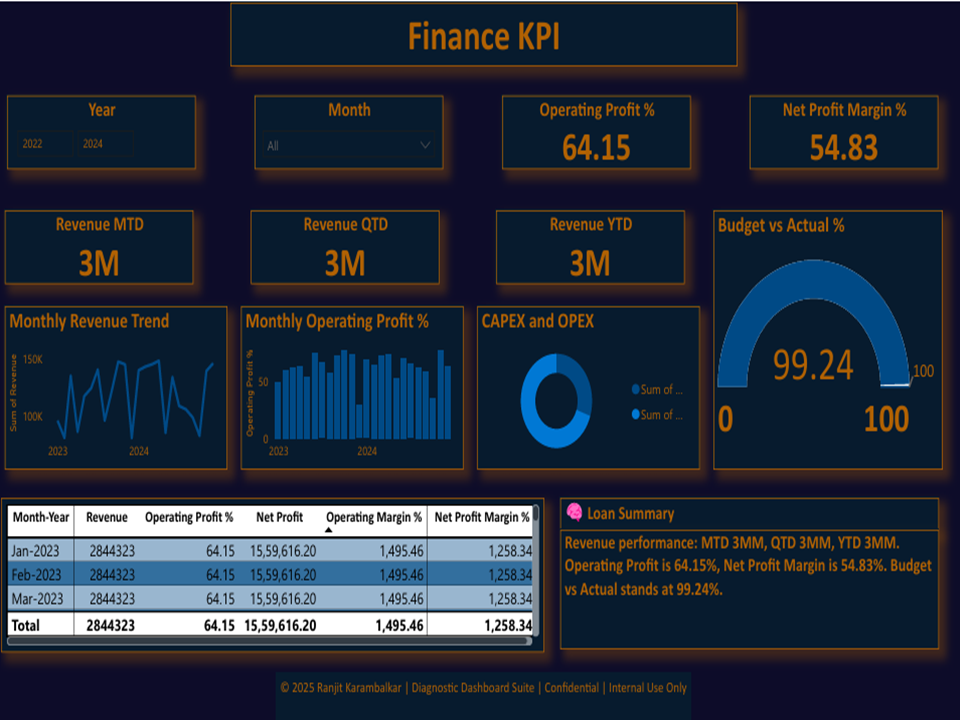
🔽 Finance KPI Dashboard
Financial Analytics📋 Scenario
Simulated startup CFO juggling burn rate, budget tracking, and board prep manually.
🎯 What I Built
KPI dashboard with views for cash flow, budget vs. actual, department spend, and profit margin. Includes forecasting logic and anomaly detection.
💡 What It Demonstrates
How finance teams can move from reactive spreadsheets to proactive insight, saving time and improving control.
Banking Dashboard Preview
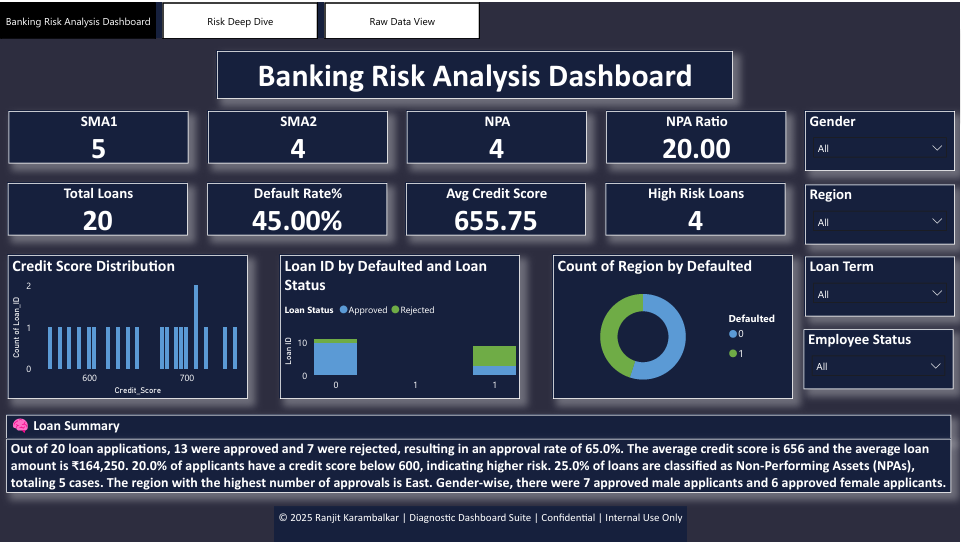
🔽 Banking Risk Analysis Dashboard
Banking & Risk📋 Scenario
Regional banks struggle with fragmented loan data, delayed risk signals, and rising regulatory pressure—making it hard to monitor NPAs and ensure compliance.
🎯 What I Built
Built a diagnostic Power BI dashboard using simulated loan data to visualize risk scorecards, early warning indicators, geographic exposure, and NPA classification. Includes dynamic filters and predictive logic for early intervention.
💡 What It Demonstrates
Improved lending decisions, reduced NPA accumulation, and enhanced regulatory readiness through consolidated views and proactive alerts.
E-commerce Dashboard Preview
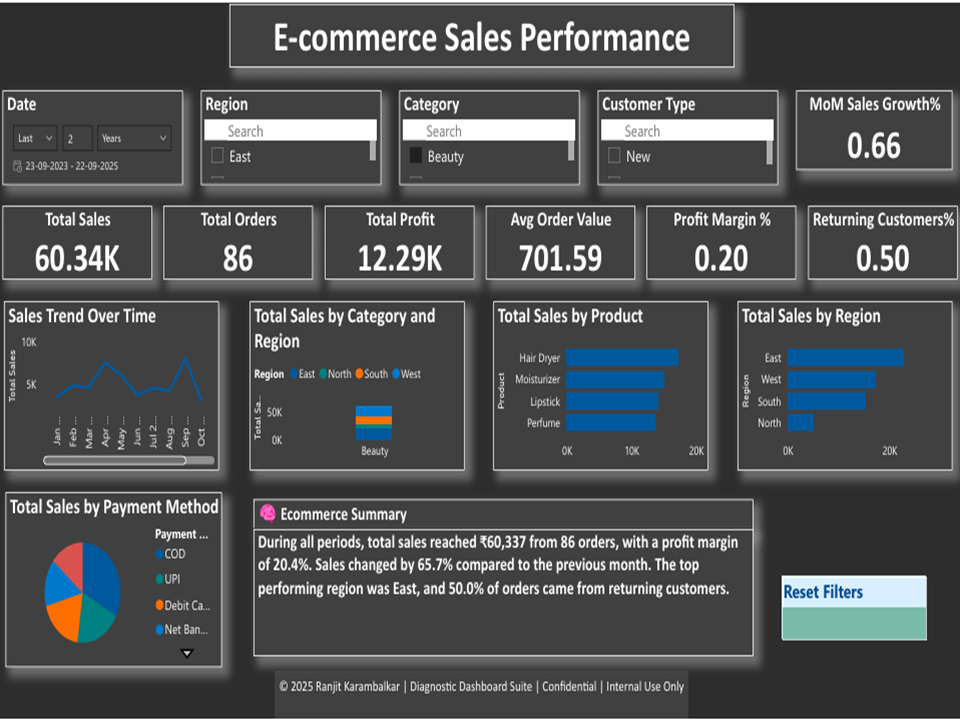
🔽 E-commerce Sales Diagnostic Dashboard
E-commerce📋 Scenario
Simulated online retailer with high cart abandonment and unclear repeat purchase behavior.
🎯 What I Built
Diagnostic dashboard showing customer journey, product performance, payment method trends, and regional breakdowns.
💡 What It Demonstrates
How behavioral insights and cohort analysis can improve conversion, retention, and channel strategy.
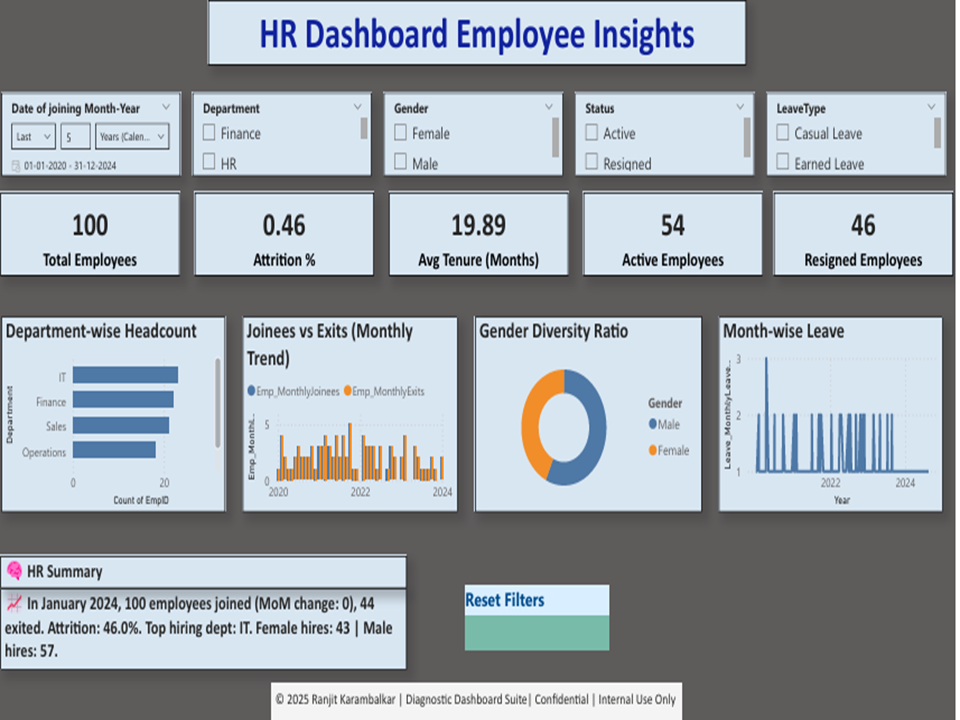
HR Dashboard Preview
🔽 HR Performance Dashboard
Human Resources📋 Scenario
Simulated tech company with rising attrition and vague exit feedback.
🎯 What I Built
Dashboard analyzing attrition by department, tenure, manager, and promotion timing. Includes early warning indicators.
💡 What It Demonstrates
How HR teams can identify retention risks and redesign career paths using performance-linked data.
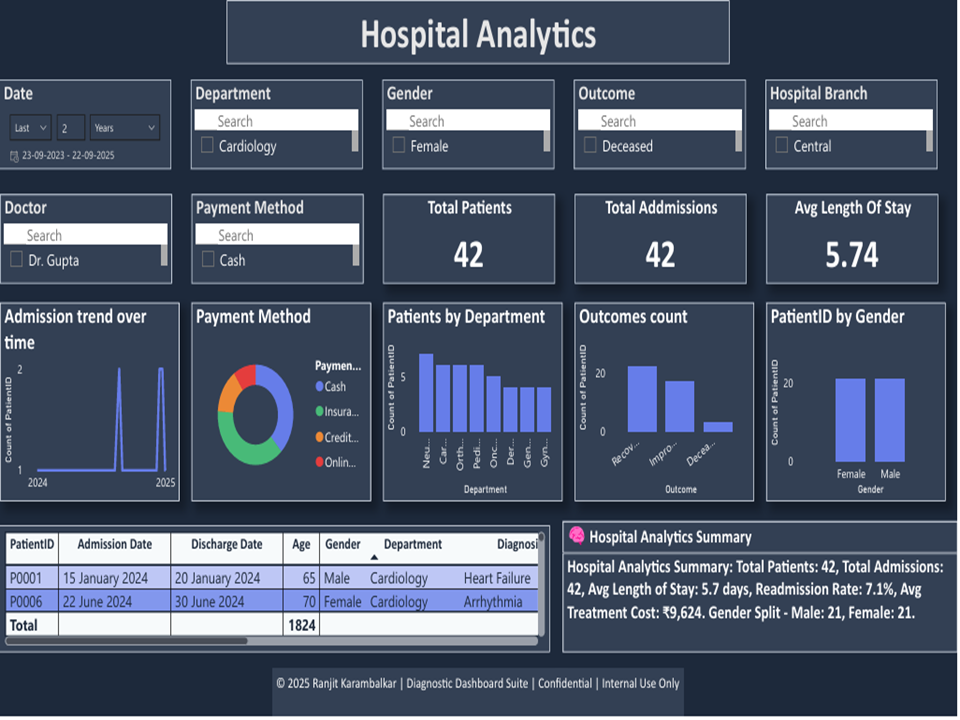
Hospital Dashboard Preview
🔽 Hospital Analytics Dashboard
Healthcare📋 Scenario
Simulated multi-specialty hospital facing delays in discharge, bed turnover, and resource allocation.
🎯 What I Built
Dashboard tracking admissions, discharges, occupancy rates, and departmental performance. Includes alerts for bottlenecks and patient flow disruptions.
💡 What It Demonstrates
How operational metrics can improve resource planning, reduce wait times, and enhance patient experience.
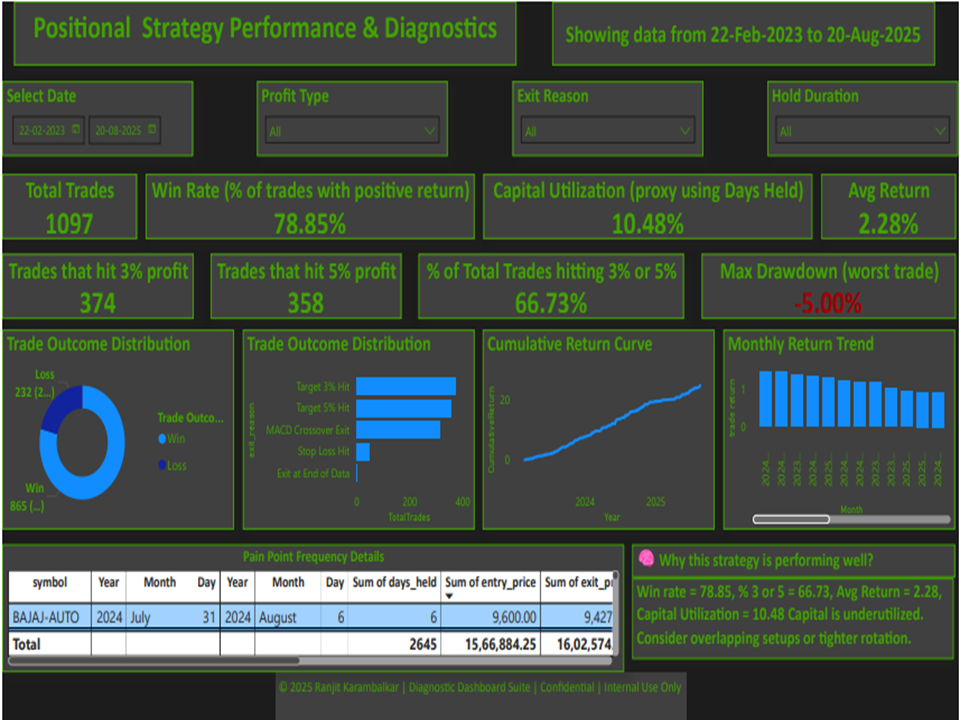
Trading Dashboard Preview
🔽 Positional Trading Strategy Dashboard
Trading & Finance📋 Scenario
Simulated trading setup focused on rotational capital logic and multi-asset strategy evaluation.
🎯 What I Built
Dashboard showing entry/exit signals, capital allocation, drawdown zones, and strategy performance across timeframes.
💡 What It Demonstrates
How traders can visualize strategy health, protect capital, and automate decision-making with diagnostic clarity.